Дисплей и голосовой контроль
Отображение статистики поездки на центре дисплея
Место в руководстве: Дисплей и голосовой контроль
~1мин чтения
Trip computer statistics can be displayed graphically in the center display, providing an overview that facilitates more fuel-efficient driving.
 Open the Производительность драйвера app in the App view to display trip statistics.
Each bar in the graph represents a driving distance of 1 kilometers, 10 kilometers or 100 kilometers (or miles). Барсы добавляются справа, когда вы ездите. The bar at the far right shows the data for the current trip.
Average fuel consumption and total driving time are calculated from the most recent reset of the trip statistics.
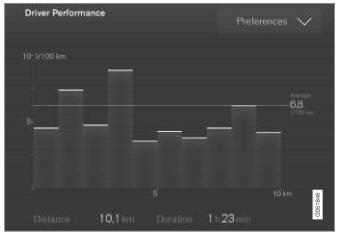
Trip computer statistics1.
1 The illustration is generic - details may vary according to vehicle model.
Проверьте себя
Короткий тест по Volvo XC90: после ответа — пояснение и ссылка на страницу руководства.
Страница помогла?